
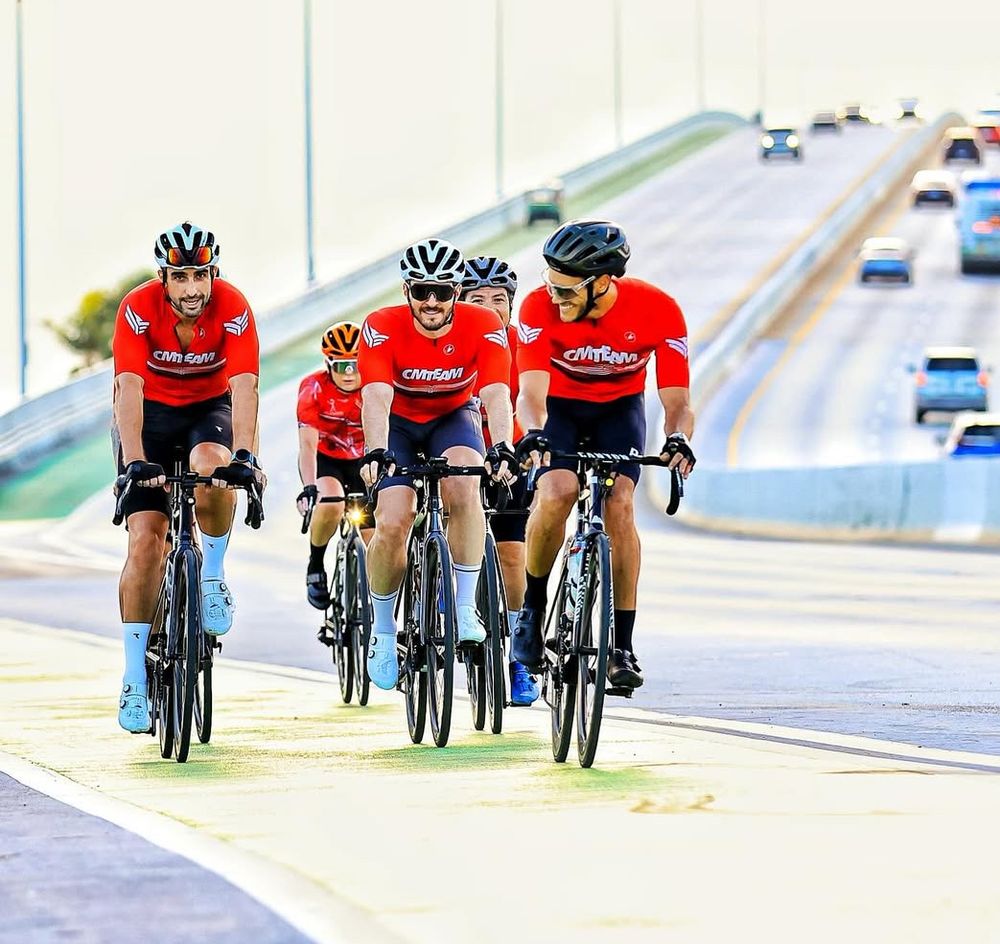
Why we measure power, what each number means and how to use it all in % of FTP. You don’t need to memorize formulas: you need to understand what each metric tells you and what to do with it.
Why train with power
Power (watts) is the only metric that directly measures the work you are producing, right now, with no lag. Heart rate is slow to rise and is affected by heat, sleep, caffeine, hydration and race-day stress. Watts show up the instant you push the pedal. They don’t lie and they don’t make excuses: they reflect exactly the effort you are making.
For a triathlete this is decisive. In an IRONMAN or a 70.3, the bike decides whether you run well or walk to the finish line. Power lets you manage your effort so you reach T2 with legs, instead of spending everything on the bike and paying the bill on the run. Heart rate is still useful as a read on your body, but power sets the pace.
Power is not about training harder. It is about training right. We are not the team that teaches you to blow up; we teach you to hold back, because fatigue is not the same as a good session. The number is there to make you aware, not to push you to the limit every day.
FTP: your 100%
What it is. FTP (Functional Threshold Power) is the highest average power you can sustain for roughly one hour without blowing up. It is your functional threshold: the line between what you can hold for a long time and what quickly drives you into fatigue.
What it’s for. It is the reference for everything. All the Energy Box zones, IF and TSS come from it. It is the value you enter in your bike computer (Garmin, Wahoo) and in TrainingPeaks.
How to find it. The most common test is the 20-minute test: your best sustained effort for 20 minutes, minus 5%. If you averaged 250 W, your FTP is about 238 W. There are also ramp tests and lab assessments.
The team’s language: % of FTP
This is the key point. Watts are personal: your FTP is different from your teammate’s. If I say “hold 280 W on the climb”, that number works for one athlete and destroys another. But if I say “hold 90% of FTP on the climb”, the instruction works for everyone: each athlete translates it into their own watts.
When everyone thinks in percentages, the team speaks a single language. The coach prescribes in %, the race plan is built in %, and each athlete executes at the watts that % represents for them. You stop comparing watts with watts, which makes no sense between different people, and start comparing relative intensity, which is universal.
- 1Prescription. “A1 at 55–74% of FTP” means the same thing for a new athlete and an experienced one.
- 2Race strategy. “Flats at 80–85%, short climbs at 95–100%, strong wind hold A2” becomes a plan everyone understands and remembers.
- 3IF control. Since IF is already a fraction of FTP, it fits naturally with targets in %. You compare like with like, not watts with “0.8-something”.
- 4Memory. Thinking in % builds a mental map of effort you can take to any race, on any bike, on any day.
Set your bike computer to show power as % of FTP (most allow it). On race day you read “92%” on the screen instead of trying to remember whether 265 W was a lot or a little for that moment.
The CMTeam Energy Box
This is our official zone table. Each zone trains a different system in the body and is defined in % of FTP, exactly the team’s language. The values below are for the bike (power). Sensitivity shows how heavily that range weighs on the body.
| Zone | % of FTP | Purpose | Sensitivity |
|---|---|---|---|
| A0 · Active Recovery | < 55% | Recovery | Moderate |
| A1 · Endurance | 55–74% | Build the aerobic base | Moderate |
| A2 · Tempo | 75–89% | Challenge aerobic endurance | Heavy |
| A3 · Threshold | 90–104% | Improve lactate tolerance | Heavy (high) |
| VO2 · VO2 Max | 105–120% | Raise the aerobic ceiling | Severe |
| AN · Anaerobic | > 120% | Maximum system challenge | Severe |
How each zone behaves in training and racing
| Zone | Physiological goal | In training | In a race |
|---|---|---|---|
| A0 | Active recovery | Continuous | You don’t race here |
| A1 | Aerobic base and economy | Continuous | Hours: IRONMAN pace |
| A2 | Metabolic sustainability | 8–30 min per block | 40–120 min: 70.3 pace |
| A3 | Lactate threshold | 4–12 min per block | 20–60 min |
| VO2 | Maximal aerobic power | 2–5 min per block | 5–12 min |
| AN | Anaerobic capacity | 10–60 s | Seconds |
Notice how everything is already in % of FTP. When your coach writes “A2” in your plan, you know the range, the goal and how long you can stay there. That is the mental shortcut we want you to carry.
NP: Normalized Power
What it is. An estimate of how much your body really “suffered”, taking changes in effort into account. No ride is perfectly steady: you push on the climbs and ease off on the descents. NP weights those surges because their physiological cost is not linear.
Why it matters. Average power hides how hard a ride full of surges really was. A session averaging 200 W with lots of corners or sprints can cost as much as a steady 224 W effort. NP captures that; the average doesn’t.
Steady ride (a well-paced IRONMAN): NP stays close to average power.
Choppy ride (rolling course, crosswinds, braking to stay out of the draft): NP rises well above the average.
It is NP, not the average, that goes into IF and TSS.
IF: Intensity Factor
What it is. How hard the ride was relative to your FTP: NP divided by FTP. If NP was 200 W and FTP is 250 W, IF is 0.80. In other words, you rode at 80% of FTP.
IF is our % language built in: an IF of 0.80 is the same as “effort at 80% of FTP”. That is why it fits directly with the strategy we build in percentages. In triathlon, bike IF is the number that best predicts how the run will go. Get the IF right and you get the whole race right.
| Bike IF | Typical triathlon context |
|---|---|
| 0,72–0,78 | IRONMAN (140.6). An effort you can sustain for 4 to 6 hours, saving legs for the marathon. |
| 0,78–0,84 | 70.3. A strong but controlled ride that protects the half marathon. |
| 0,84–0,90 | Shorter races (Olympic) or advanced athletes in a 70.3. |
| 0,90–1,00 | Pure time trial or sprint. Right near threshold, with no long run afterwards. |
An athlete who rides the IRONMAN bike with too high an IF almost always pays for it on the run. Discipline with IF is what separates a good bike split from a good race.
TSS: Training Stress Score
What it is. A single number that combines intensity and duration to tell you how much that ride took out of you overall. The reference is simple: one hour exactly at FTP equals 100 TSS.
That is why different sessions can be compared on the same scale. An easy 2-hour ride (IF 0.70) gives about 98 TSS. A hard 30-minute session (IF 0.95) gives about 45 TSS. An IRONMAN bike can add up to 250–320 TSS; knowing that helps you size the effort and understand how much is left for the run.
- 1Plan the week. Adding up TSS shows whether the load is light, right or excessive.
- 2Size the race. Estimating bike TSS helps you plan pacing and effort management.
- 3Track your form. TSS is the basis of the fitness and fatigue charts in TrainingPeaks.
You don’t calculate anything by hand: your bike computer and TrainingPeaks do it. But understand the idea: TSS is the price each session charges your body.
VI: Variability Index
What it is. How steady, or choppy, your ride was. It is NP divided by average power. A VI of 1.0 means a perfectly smooth effort; the higher it is, the more surges.
Why it’s critical in triathlon. Riding unevenly costs more than riding smoothly, even at the same average watts. Variable effort produces more lactate and burns more glycogen, and you need that glycogen to run. A high bike VI is one of the strongest predictors of a bad run.
| Bike VI | What it means |
|---|---|
| 1,00–1,05 | Excellent. The target for IRONMAN and 70.3 bikes: smooth riding, energy saved for the run. |
| 1,05–1,08 | Acceptable on rolling or windy courses. |
| > 1,08 | Warning sign. Usually poor pacing: unnecessary surges that will cost you on the run. |
The number is there to make you aware,
not to push you to the limit.